A Particle weather dashboard with LVGL, cloud secrets, and Ledger

Ready to build your IoT product?
Create your Particle account and get access to:
- Discounted IoT devices
- Device management console
- Developer guides and resources
Introduction
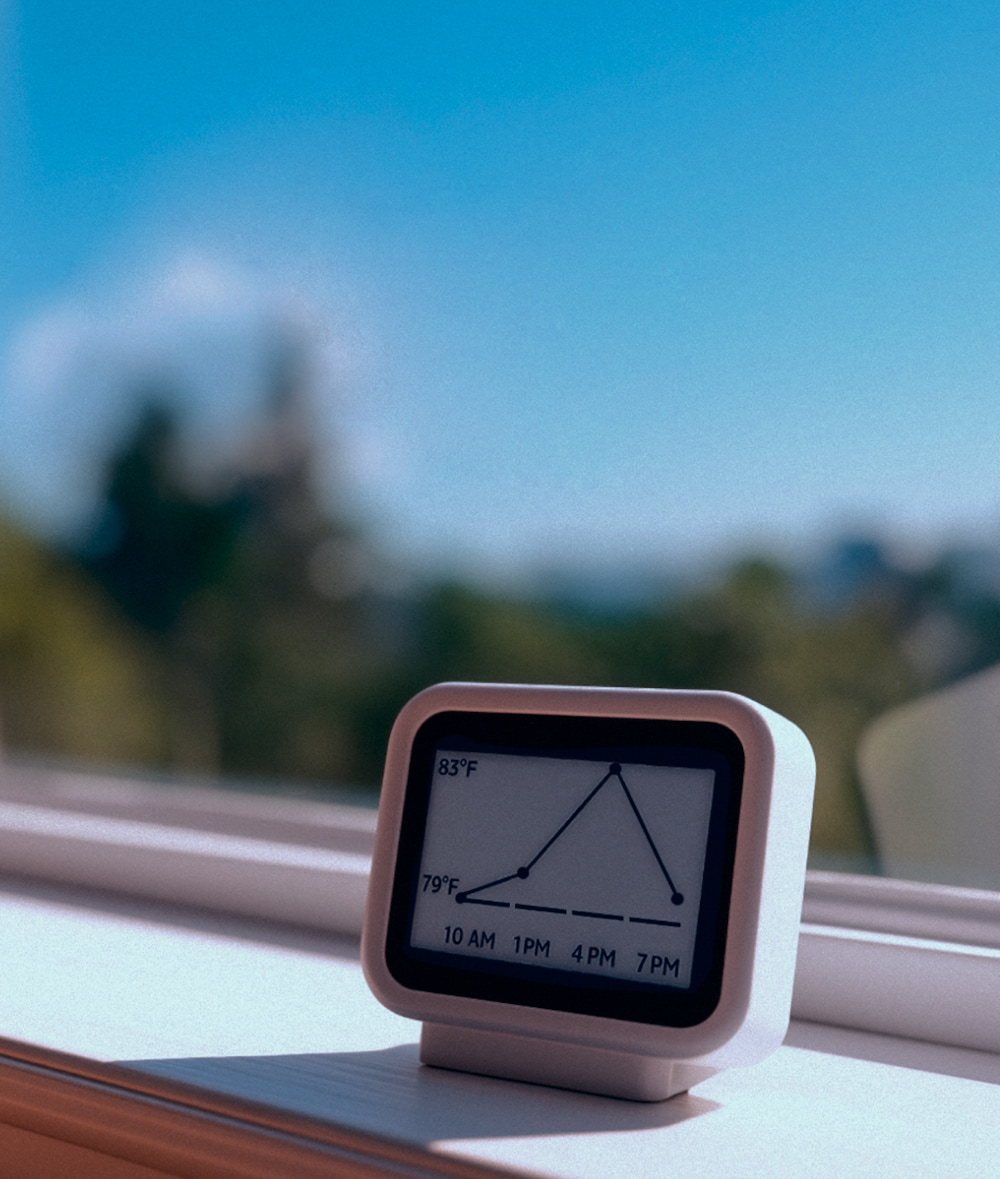
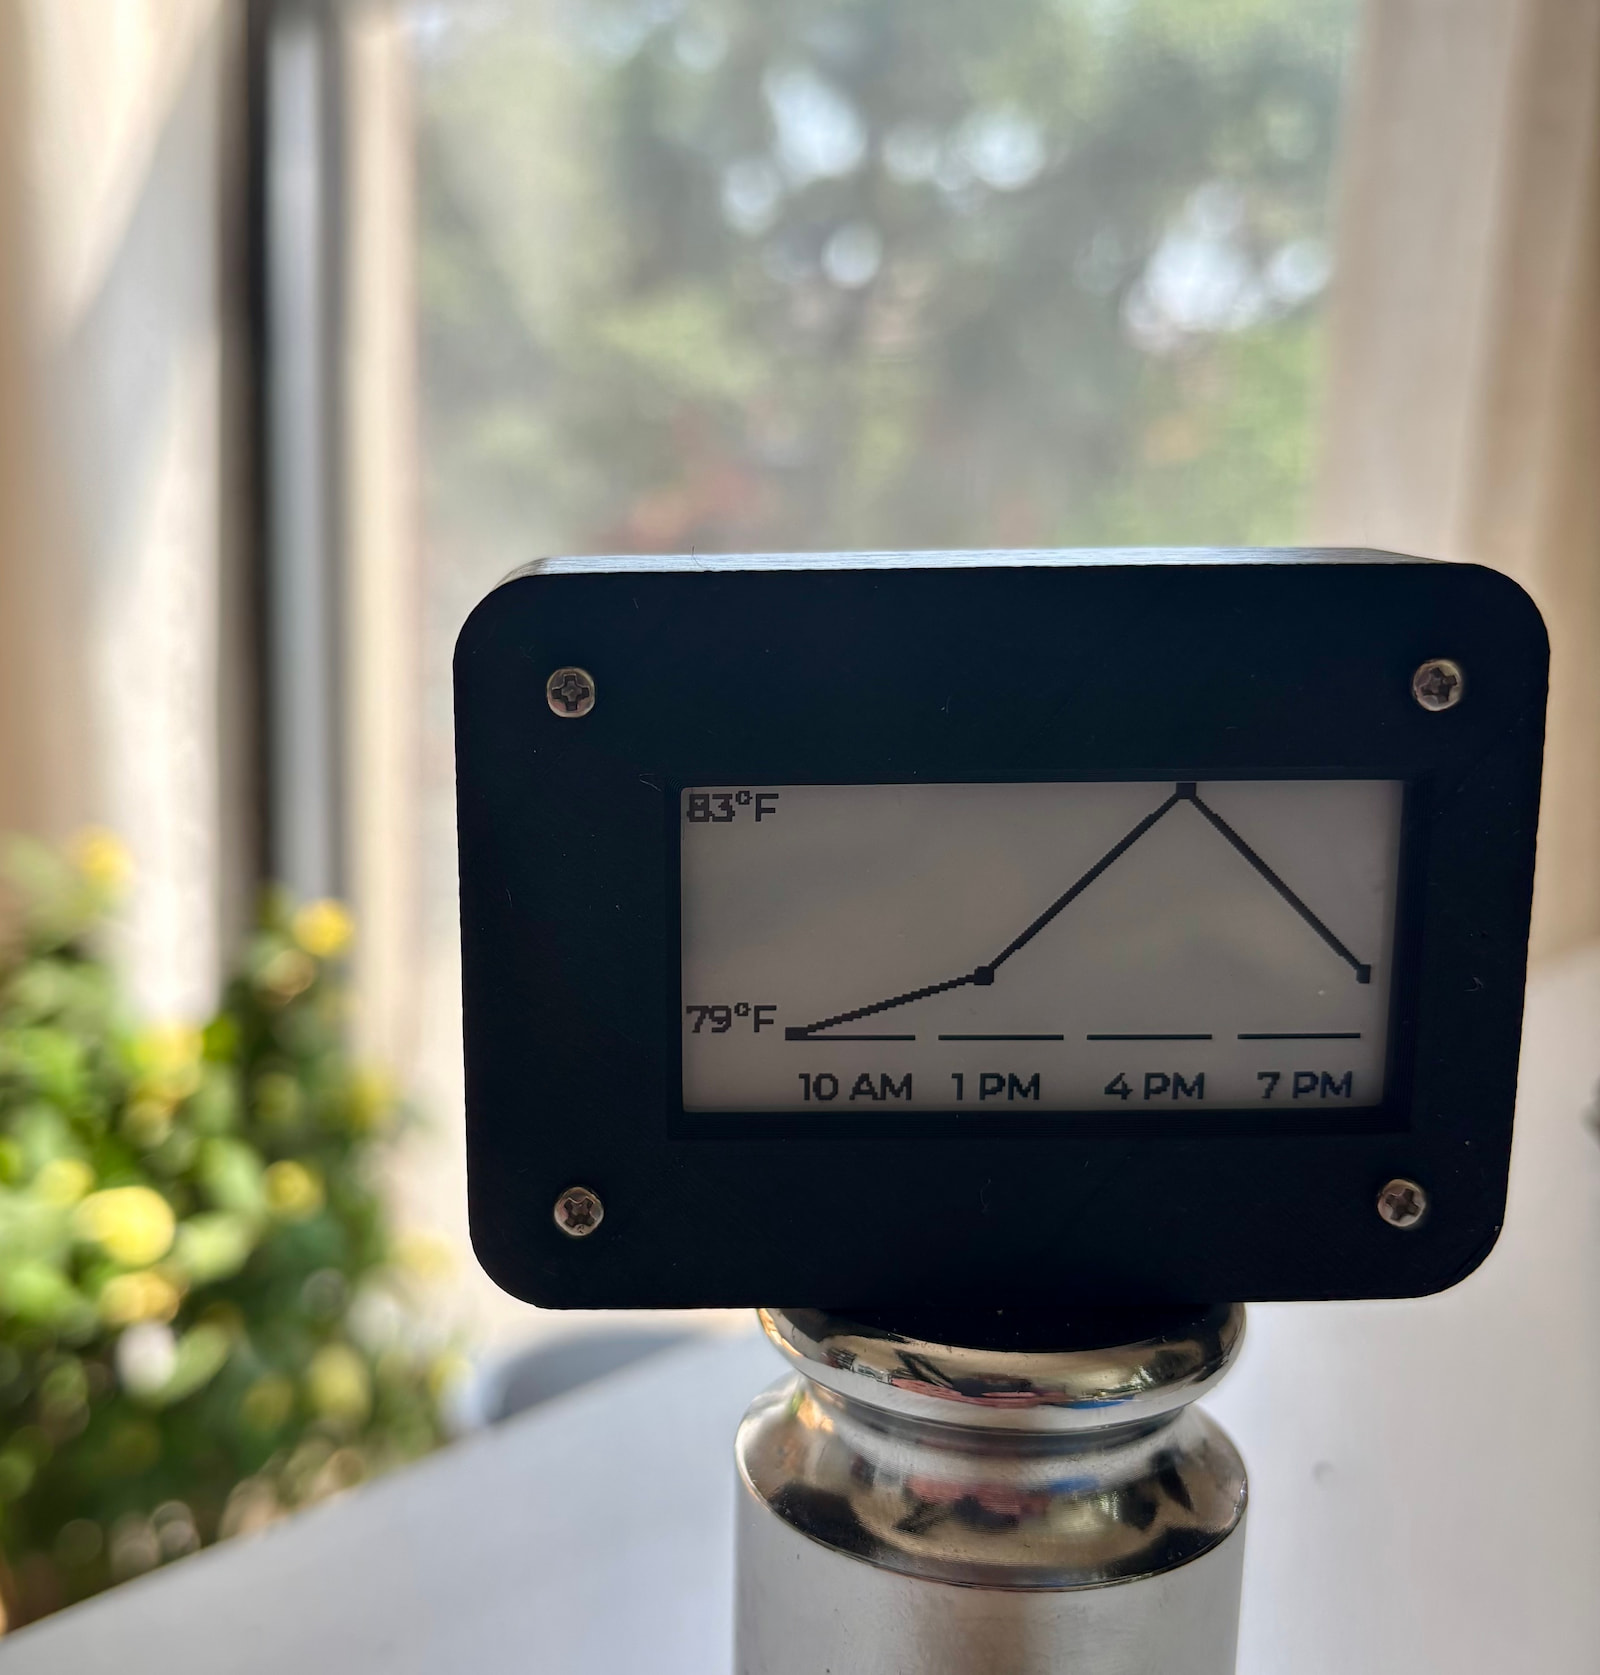
It’s nice to know the weather at a glance. In this project, we’ll use a Particle Photon 2 with the Light and Versatile Graphics Library (LVGL), and some of Particle’s new cloud features to develop a weather widget. On an ePaper display from Adafruit, the device will graph the temperature and chance of precipitation over the next couple of hours. The data be fetched from OpenWeather API using a Particle custom webhook. The Photon will be configured to be very “sleepy,” only waking up once per hour to update the display in an attempt to maximize battery life.
Hardware
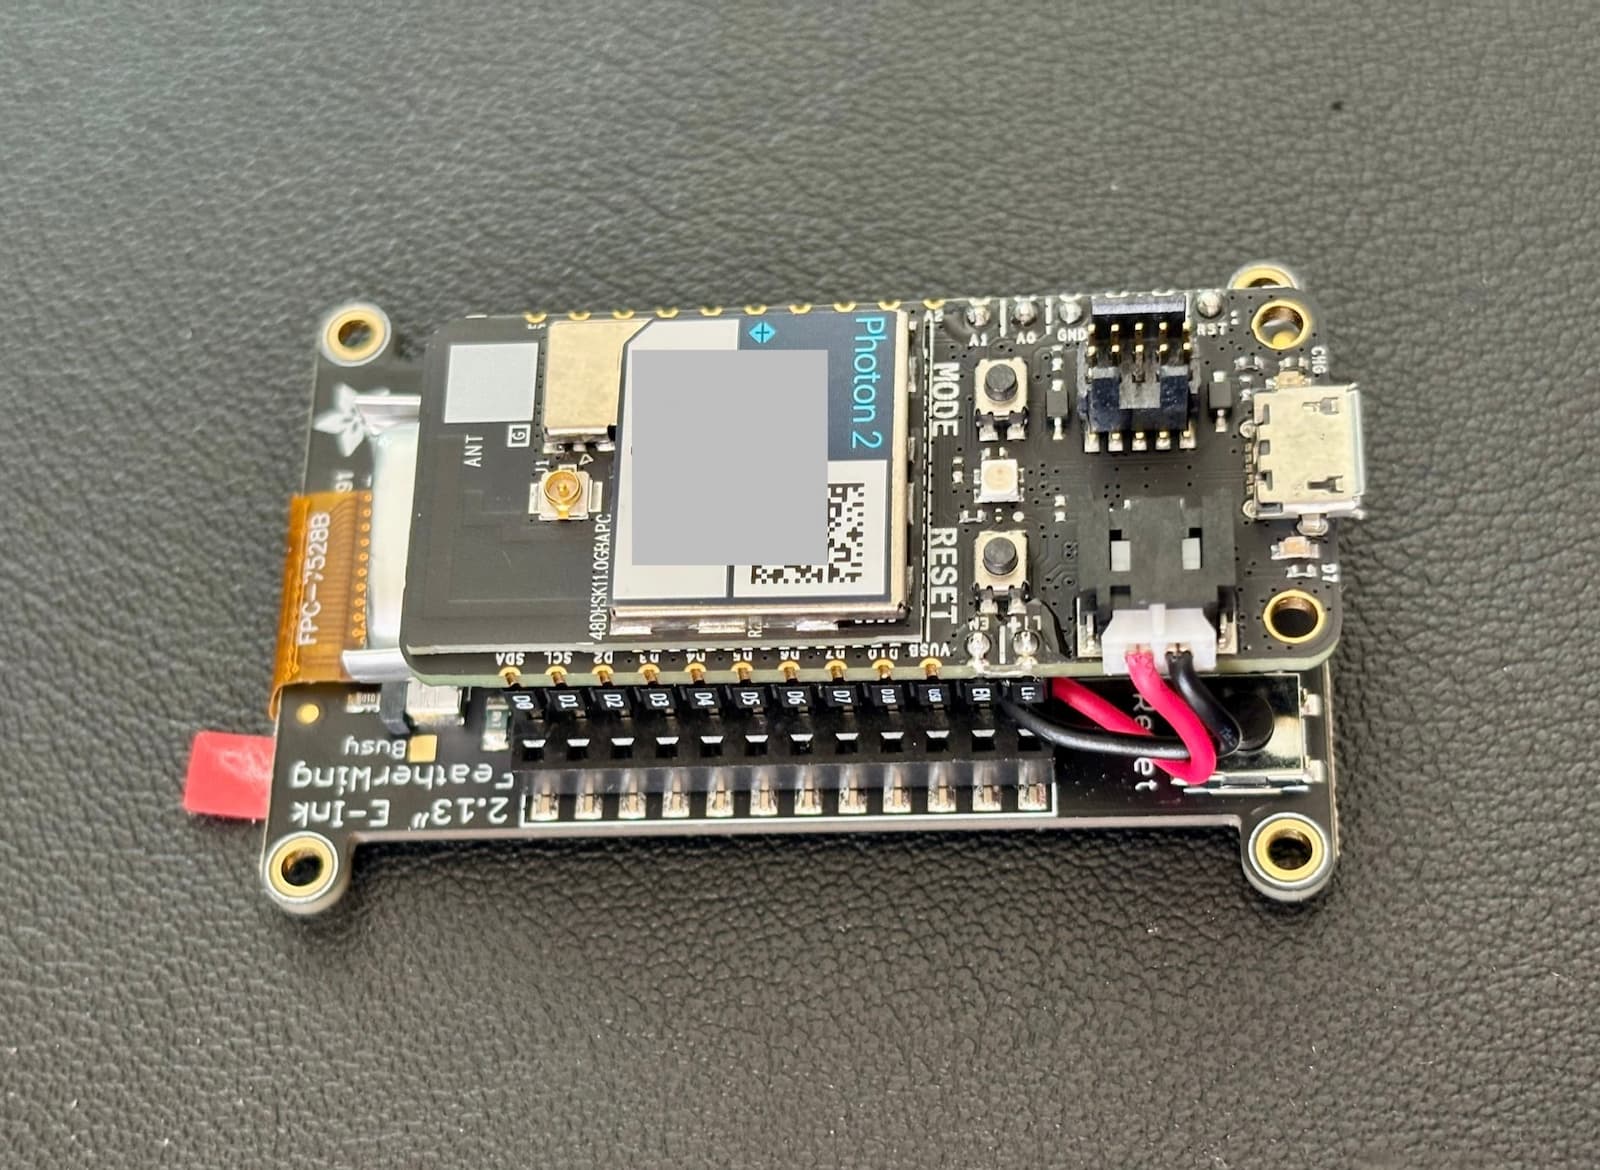
The hardware for this project is very straightforward. The eInk FeatherWing is directly compatible with the Photon 2. The 400mAh battery from Adafruit was selected, so it would fit snugly between the two development boards.
Particle Cloud
Next, we can start configuring the cloud infrastructure for the project in the Particle Console. Make sure to have the Photon properly configured and assigned to a product by following the steps defined in setup.particle.io. The setup steps will also prompt for Wi-Fi credentials, which the Photon will use to connect.
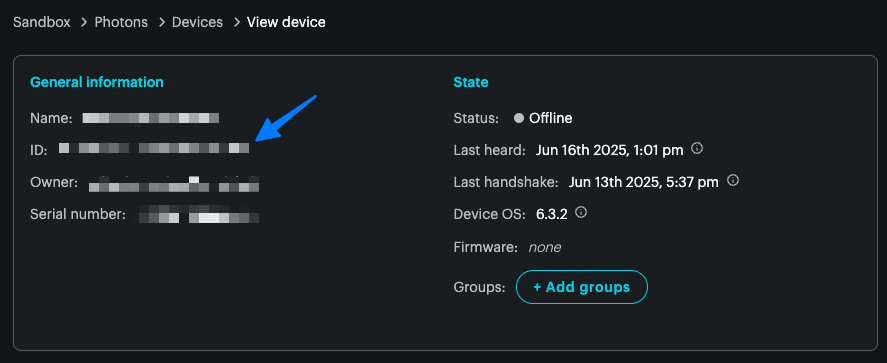
Once configured, make note of the device ID in the device details page.
center
OpenWeather API
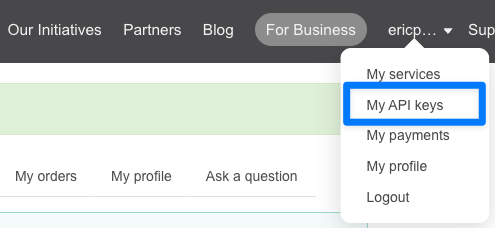
The OpenWeather API is used to fetch the current weather for the device’s location. To get an API key, create an account with OpenWeather and navigate to “My API keys” once logged in.
center
Make note of the default API key provided. We’ll need this later.
Once a new API key is generated (or a new account is created), it will take 45 minutes for it to become active.

center
Cloud secrets
Now we’ll store the OpenWeather API key in the Particle Console. Log in to the console and navigate to the organization (or sandbox) level. On the navigation panel, select “Cloud secrets.”
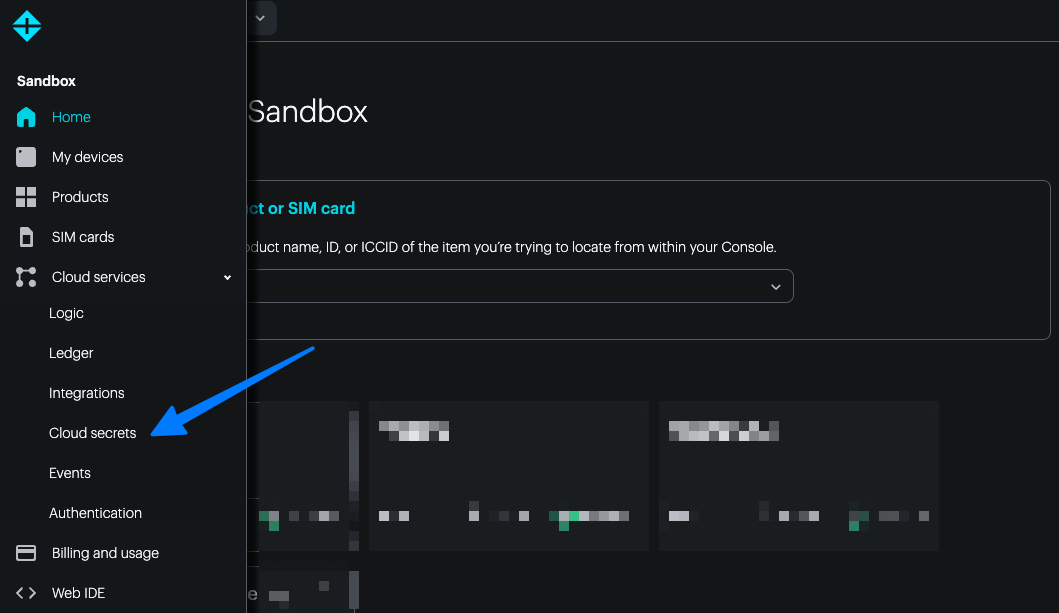
Select “+ Create new secret.”

center
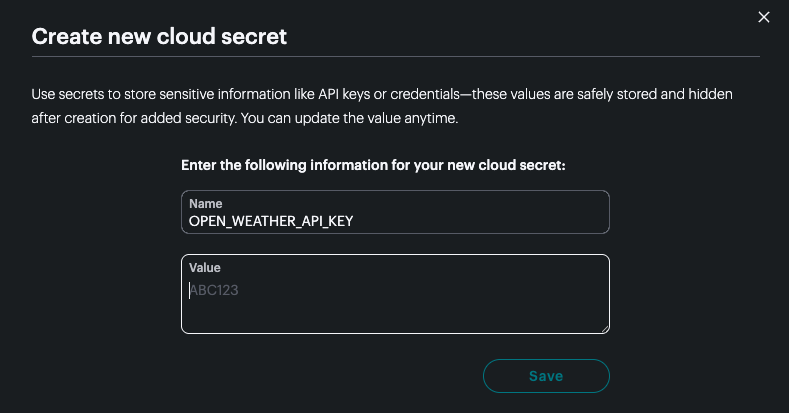
Give it a name, OPEN_WEATHER_API_KEY in this case, and provide the value copied from the previous section. The API key can now be referenced anywhere else in the Particle Console and updates will propagate to all of the resources that reference it.
center
Device Ledger
While still in the organization (or sandbox) scope, navigate to the Ledger cloud resource and choose “+ Create new Ledger.”
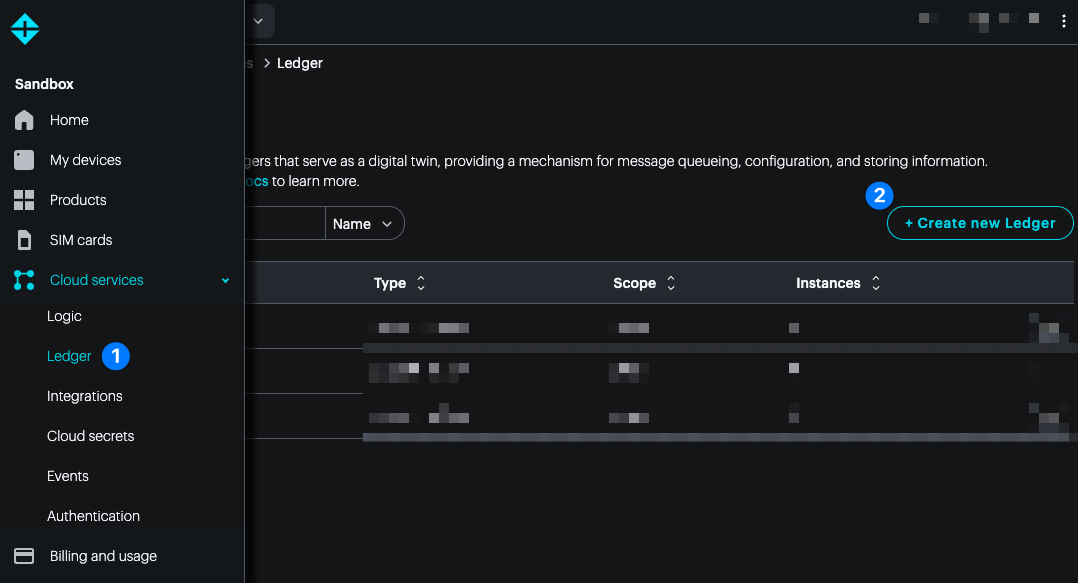
Select “Cloud to Device Ledger” and fill out the name and description fields. Choose “device” for the Ledger’s scope and save the Ledger.
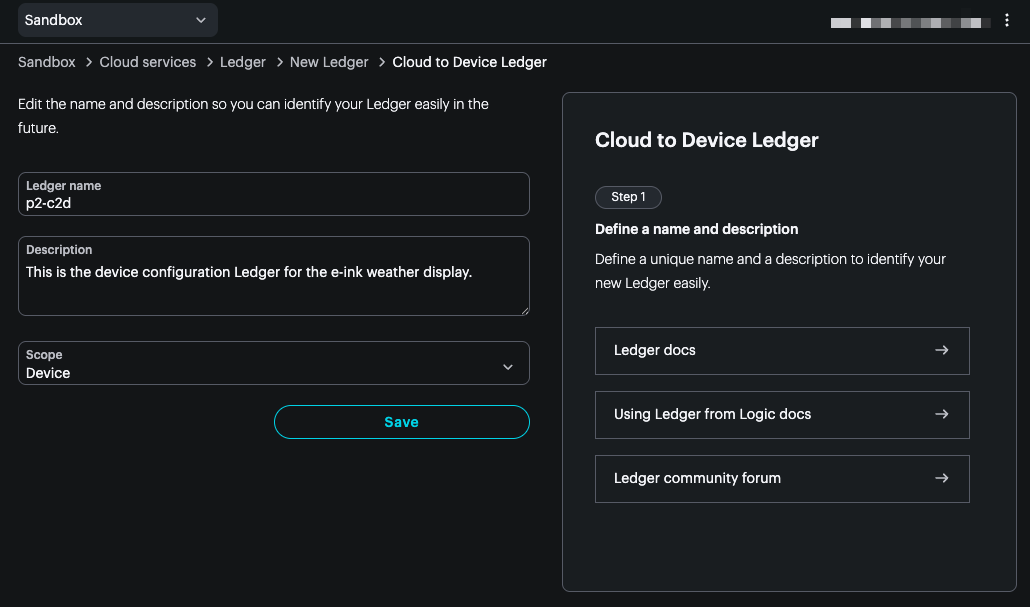
Once the Ledger has been created, select “Create new instance.”
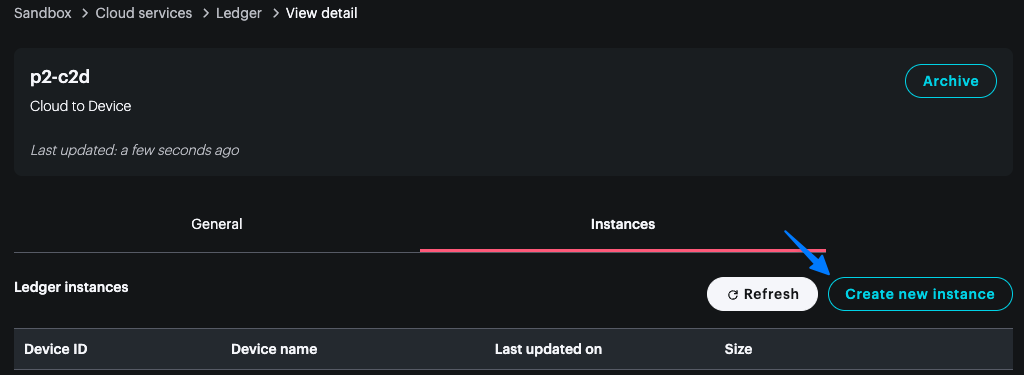
Provide your Photon’s device ID and fill out the following fields to be saved in the new Ledger instance.
| lat | The latitude where your device will be located. |
| lon | The longitude where your device will be located. |
| posix_tz | The device’s timezone posix string. This can be found for various locations here. |
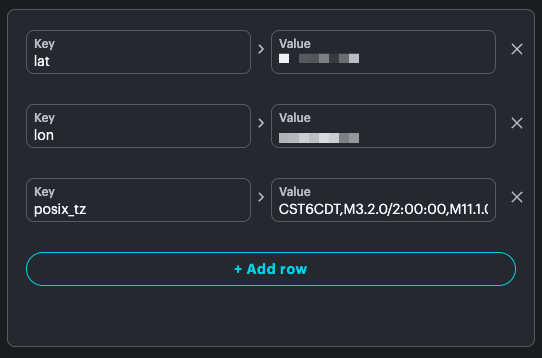
center
Now, each time the device resets, it will sync these parameters from the Ledger instance. With this configuration, you can deploy devices around the world all running the exact same firmware; the location and timezone will be synchronized for each individual device without any complex handling.
Custom webhook
While at the product level, navigate to Cloud Services > Integrations. Then choose “+ Add new integration.”

center
Search for “Custom Webhook” and choose “Start now.”
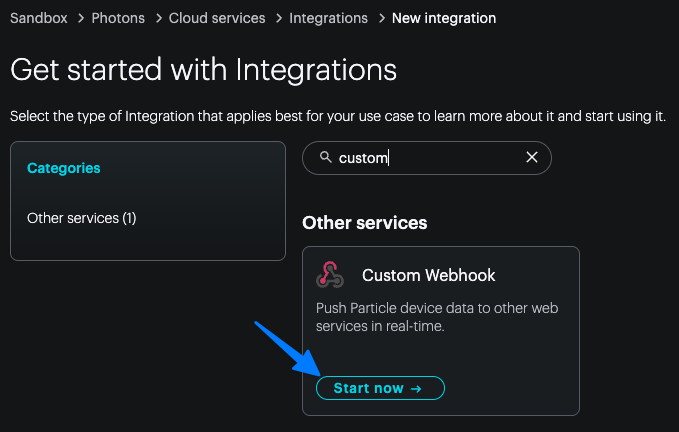
center
Fill out the following parameters for the new custom webhook. The API URL we’ll be using is: https://api.openweathermap.org/data/2.5/forecast and we’ll be making a GET request.
You may name the webhook anything; however, be sure to provide weather for the event name.
In the cloud secrets section, choose the OpenWeather API Key we configured earlier.
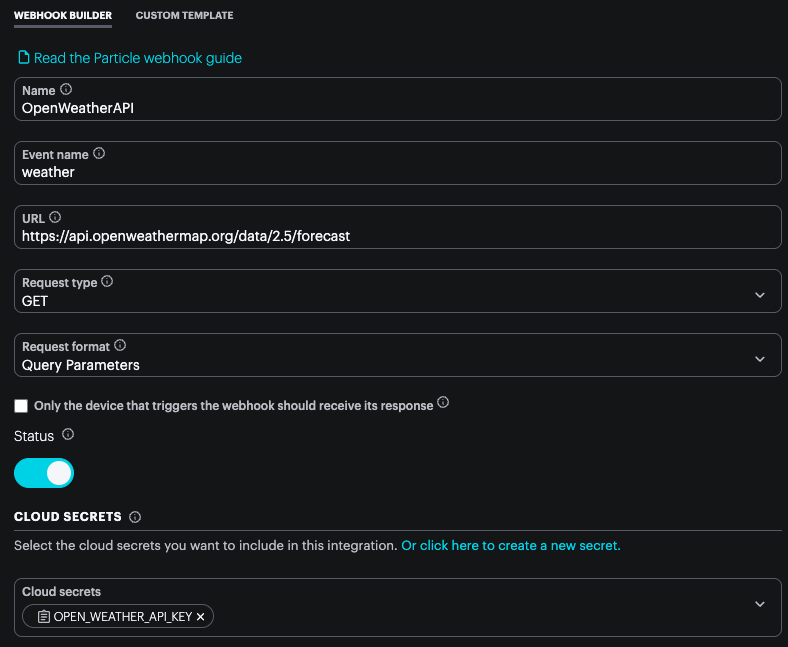
center
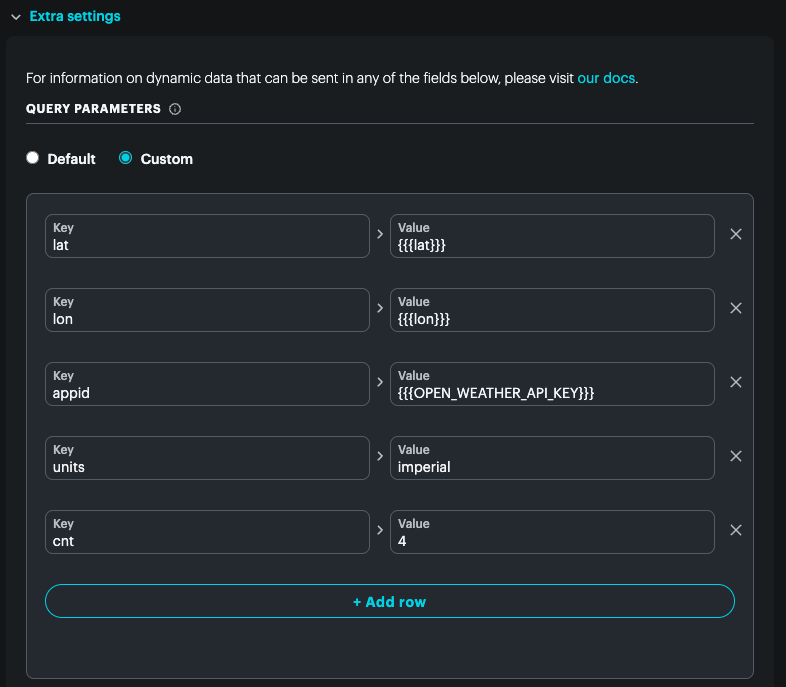
Next, expand the “Extra settings” section and create the following parameters:
| lat | {{{lat}}} |
| lon | {{{lon}}} |
| appid | {{{OPEN_WEATHER_API_KEY}}} |
| units | The units type: “imperial” or “metric”. |
| cnt | 4 (this should match the firmware). |
center
Keep the remaining settings as default and save the new OpenWeather API custom webhook.
Firmware
Moving on to the firmware, we can start to put everything into place. This project uses a port of LVGL specifically configured for this ePaper display. You can start from the empty LVGL example and build up, or copy the final code directly. We won’t go through every single line, however there are some notable sections.
Libraries
There are a few libraries used for this project: LVGL, Adafruit_EPD_RK, JsonParserGeneratorRK, LocalTimeRK. You can read more about what each does by following their links.
#include <lvgl.h>
#include <Adafruit_EPD_RK.h>
#include "JsonParserGeneratorRK.h"
#include "LocalTimeRK.h"
Setup
In the setup function, LVGL and the display are configured. Then, we subscribe to <device_id>/hook-response/weather for the response from our custom webhook. Finally, we configure the Ledger instance and force it to sync each time the device reboots with the following line ledgerSyncCallback(deviceConfig, nullptr);.
lv_init();
lv_tick_set_cb(my_tick);
lv_log_register_print_cb(my_print);

lv_display_t *disp;
disp = lv_display_create(HOR_RES, VER_RES);
lv_display_set_flush_cb(disp, my_disp_flush);
lv_display_set_buffers(disp, draw_buf, NULL, sizeof(draw_buf), LV_DISPLAY_RENDER_MODE_PARTIAL);

Log.info("Starting display...");
epd.begin();
epd.clearBuffer();

String topic = Particle.deviceID() + "/hook-response/weather";
Particle.subscribe(topic, handleWeatherResponse);

deviceConfig = Particle.ledger("photon2-c2d");
deviceConfig.onSync(ledgerSyncCallback);
ledgerSyncCallback(deviceConfig, nullptr);
Loop
In the main event loop, we wait for the device to connect to the Particle Cloud and check to make sure the Ledger information is up to date with the didSync flag.
Then, we publish a weather event containing the information passed down by the Ledger including lat and lon . This example uses the new extended publish features available in Device OS 6.3+.
if (!didPublish)
{
    Variant obj;
    obj.set("lat", latitude);
    obj.set("lon", longitude);
    obj.set("cnt", NUM_FORECAST_ENTRIES);

    event.name("weather");
    event.data(obj);

    Log.info("Publishing event...");

    // We'll set the didUpdateScreen flag on the callback function to the webhook
    Particle.publish(event);
    waitForNot(event.isSending, 60000);

    if (event.isSent())
    {
        Log.info("publish succeeded");
        event.clear();
        // Don't need to clear the flag because a hibernate will reset the device
        didPublish = true;
	   }
	   else if (!event.isOk())
     {
        Log.info("publish failed error=%d", event.error());
        event.clear();
     }
}
If the screen is fully updated as determined by drawWeatherForecast() then we can safely go to sleep.
It’s worth noting that we’re using the HIBERNATE sleep mode that is available on the Photon 2. As a result, the device will completely reset the after the predetermined time expires, 60 minutes in this case.
if (didUpdateScreen)
{
    Log.info("Going to sleep for 60 minutes...");
    SystemSleepConfiguration config;
    config.mode(SystemSleepMode::HIBERNATE)
        .duration(60min);
    System.sleep(config);
    Log.info("Woke up from sleep");
}
Parsing the JSON
handleWeatherResponse is passed to the subscribe call in setup. This callback function is responsible for parsing through the JSON tree provided by the OpenWeather custom webhook.
The JsonParserGeneratorRK library makes this much easier. You’ll note that the UTC time, provided by the OpenWeather API, is converted into local time using the LocalTimeRK library. This library is passed the posix_tz string from the device’s Ledger instance. You can find the necessary string for your location here.
if (!jsonParser.addChunkedData(event, data))
{
    Log.error("Failed to add chunked data, might need to allocate more space for data");
    return;
}
if (!jsonParser.parse())
{
    // Parsing failed, likely due to an incomplete response, wait for more chunks
    return;
}

JsonReference root = jsonParser.getReference();
JsonReference apiList = root.key("list");

int count = apiList.size();

// Populate forecastList with API data
for (int i = 0; i < count && i < NUM_FORECAST_ENTRIES; i++)
{
    JsonReference entry = apiList.index(i);

    float temp = entry.key("main").key("temp").valueFloat();
    float pop = entry.key("pop").valueFloat() * 100;
    time_t epoch = entry.key("dt").valueUnsignedLong();

    LocalTimeConvert conv;
    conv.withTime(epoch).convert();
    String formatted = conv.format("%I %p");

    if (formatted.startsWith("0"))
        formatted.remove(0, 1);

    // Populate forecast entry
    forecastList[i].temp = temp;
    forecastList[i].precip = (int)pop;
    forecastList[i].dt_txt = formatted;

    Log.info("Entry %d: Temp: %.1f F, Precip: %d%%, Time: %s",
                i, temp, (int)pop, formatted.c_str());

    if (temp > maxTemperature)
        maxTemperature = temp;
    if (temp < minTemperature)
        minTemperature = temp;
}

drawWeatherForecast(); // Redraw the forecast
Updating the screen
Finally, the forecast is drawn to the screen using LVGL. It’s worth reading up on the LVGL APIs as there’s a bit of a learning curve. In this case, we’re creating two charts: a line chart for the temperature, and a bar graph for the percent precipitation.
Then, we loop through the forecastList generated by the API response handler and add the corresponding points to the charts.
The temperature graph is automatically scaled based on the max and min of the forecast’s temperature, while the precipitation chart will always be between 0 and 100 percent.
Once complete, indicate to the main loop that the screen has been updated and that we’re ready to go back to sleep by setting the didUpdateScreen flag.
lv_obj_t *screen = lv_scr_act();

lv_obj_clean(screen);

int chartWidth = HOR_RES - X_OFFSET - PADDING;
int chartHeight = VER_RES - Y_OFFSET - PADDING;

// Create temperature chart
lv_obj_t *temp_chart = lv_chart_create(screen);
lv_obj_set_size(temp_chart, chartWidth, chartHeight);
lv_obj_align(temp_chart, LV_ALIGN_BOTTOM_LEFT, X_OFFSET, -Y_OFFSET);

lv_chart_set_type(temp_chart, LV_CHART_TYPE_LINE);
lv_chart_set_update_mode(temp_chart, LV_CHART_UPDATE_MODE_CIRCULAR);
lv_chart_set_range(temp_chart, LV_CHART_AXIS_PRIMARY_Y, minTemperature, maxTemperature);
lv_chart_set_point_count(temp_chart, NUM_FORECAST_ENTRIES);

// Add padding settings for alignment
lv_obj_set_style_pad_all(temp_chart, 0, 0);
lv_chart_set_div_line_count(temp_chart, 0, 0);

lv_chart_series_t *temp_series = lv_chart_add_series(temp_chart, lv_color_black(), LV_CHART_AXIS_PRIMARY_Y);

// Create precipitation chart
lv_obj_t *precip_chart = lv_chart_create(screen);
lv_obj_set_size(precip_chart, chartWidth, chartHeight); // Match temp chart size
lv_obj_align(precip_chart, LV_ALIGN_BOTTOM_LEFT, X_OFFSET, -Y_OFFSET);

lv_chart_set_type(precip_chart, LV_CHART_TYPE_BAR);
lv_chart_set_range(precip_chart, LV_CHART_AXIS_PRIMARY_Y, 0, 100);
lv_chart_set_point_count(precip_chart, NUM_FORECAST_ENTRIES);

lv_obj_set_style_bg_opa(precip_chart, LV_OPA_TRANSP, 0);
lv_obj_set_style_border_opa(precip_chart, LV_OPA_TRANSP, 0);
lv_obj_set_style_pad_all(precip_chart, 0, 0);
lv_chart_set_div_line_count(precip_chart, 0, 0);

// Use gray color for precipitation bars
lv_chart_series_t *precip_series = lv_chart_add_series(precip_chart, lv_color_hex(0x606060), LV_CHART_AXIS_PRIMARY_Y);

// Set temperature and precipitation points
for (int i = 0; i < NUM_FORECAST_ENTRIES; i++)
{
lv_chart_set_value_by_id(temp_chart, temp_series, i, (int)forecastList[i].temp);
lv_chart_set_value_by_id(precip_chart, precip_series, i, (int)forecastList[i].precip);

lv_obj_t *label_x = lv_label_create(screen);
lv_label_set_text(label_x, forecastList[i].dt_txt.c_str());
// Align the label to the bottom left of the chart, multiplier determined by trial and error
lv_obj_align(label_x, LV_ALIGN_BOTTOM_LEFT, (X_OFFSET + 5) + (i * 54), 0);
}

lv_obj_set_style_opa(precip_chart, LV_OPA_50, LV_PART_ITEMS);

lv_chart_refresh(temp_chart);
lv_chart_refresh(precip_chart);

// Create label for maximum temperature
char maxTempBuf[8];
snprintf(maxTempBuf, sizeof(maxTempBuf), "%.0f°F", maxTemperature);

lv_obj_t *label_y_end = lv_label_create(screen);
lv_label_set_text(label_y_end, maxTempBuf);
lv_obj_align(label_y_end, LV_ALIGN_TOP_LEFT, PADDING, PADDING);

// Create label for minimum temperature
char minTempBuf[8];
snprintf(minTempBuf, sizeof(minTempBuf), "%.0f°F", minTemperature);

lv_obj_t *label_y_start = lv_label_create(screen);
lv_label_set_text(label_y_start, minTempBuf);
lv_obj_align(label_y_start, LV_ALIGN_BOTTOM_LEFT, PADDING, -Y_OFFSET);

lv_refr_now(NULL); // Eink refresh
didUpdateScreen = true;
Conclusion
This project shows how to use a number of Particle features such as cloud secrets, Ledger, and custom webhooks to create a portable weather forecast display. The device could be easily configured for any location without having to run unique firmware builds by making use of Ledger. Cloud secrets makes it easy to manage your external API keys in one convenient location. These techniques could be used to make a robust network of IoT devices on the Particle network.
Ready to get started?
Order your Photon 2 from the store.
